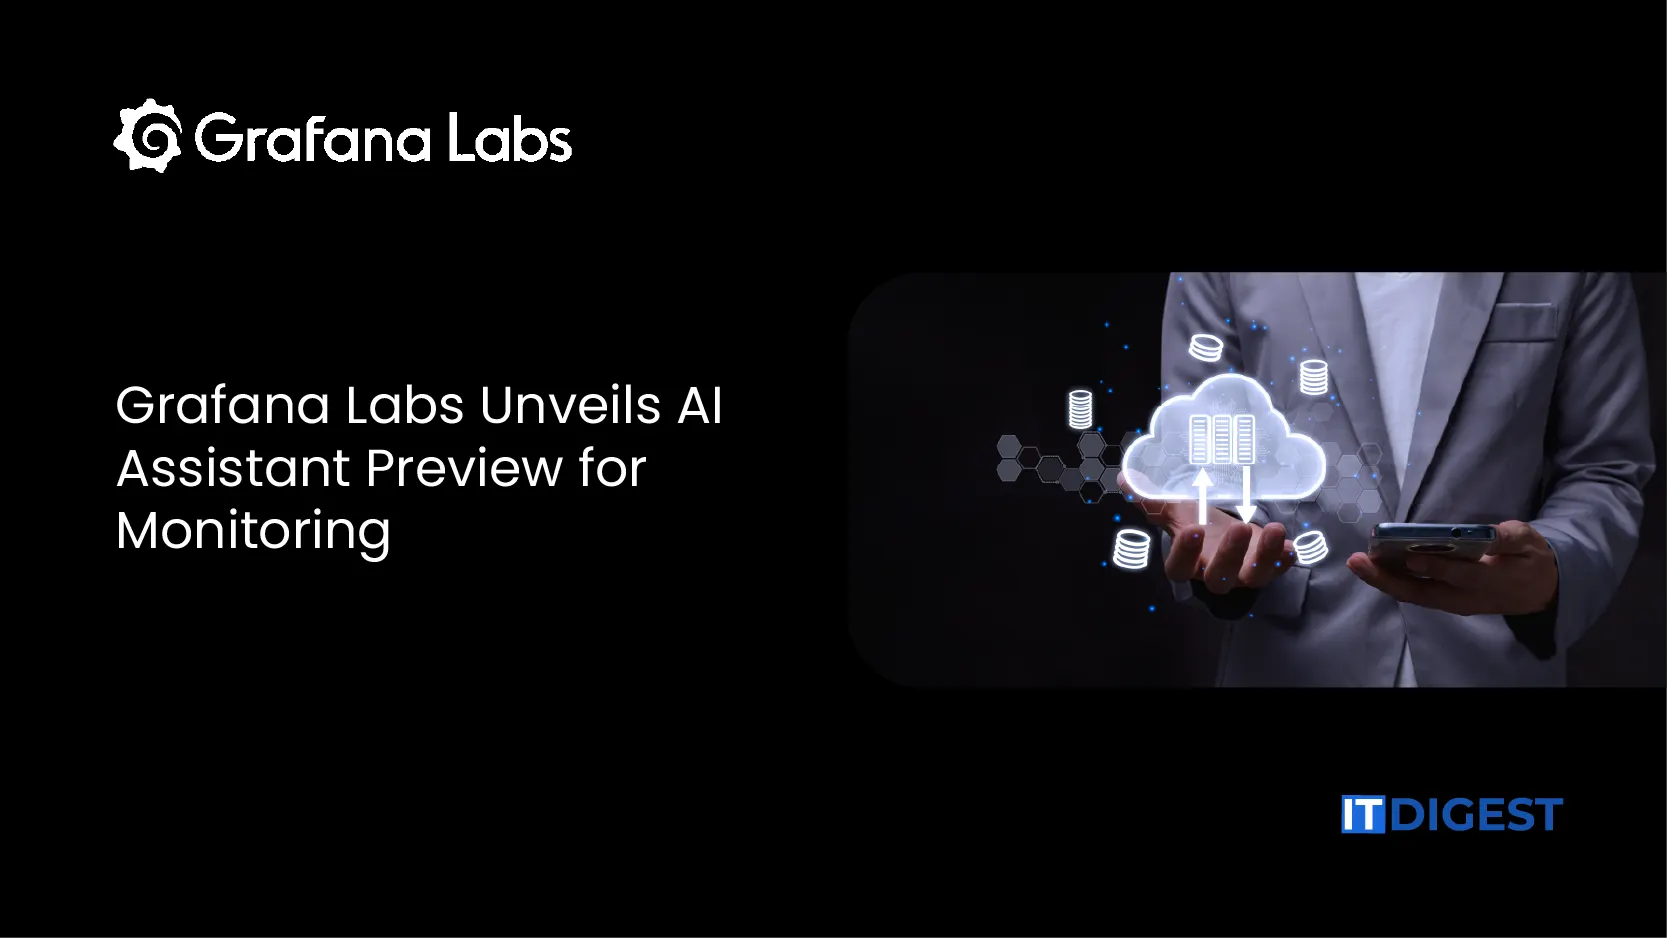
Grafana Cloud, the AI-driven observability platform, introduces an AI agent built for observability workflows, helping teams manage complex systems with automated insights, contextual alerts, and intelligent monitoring recommendations
Grafana Labs, the company behind the open observability cloud, has announced the public preview of Grafana Assistant, an AI-driven observability solution that allows teams to engage with logs, metrics, and traces through natural language. Now available to all Grafana Cloud users, the Assistant is designed to accelerate root cause analysis, automate query generation, and simplify monitoring workflows for developers, SREs, and IT professionals at every level of expertise.
As artificial intelligence reshapes the way organizations build and operate software, observability must keep pace with the speed, scale, and complexity of today’s digital environments. According to Grafana Labs’ 2025 Observability Survey, complexity and the signal-to-noise ratio remain the two most pressing challenges faced by observability teams.
Grafana Assistant was developed to directly address these challenges, making observability data more conversational, actionable, and approachable than ever before.
“There’s no doubt that AI is accelerating the pace of innovation. As more organizations adopt a software-driven mindset, they’re using AI to rewire how they operate, from revenue and operations to reliability and customer experience,” said Tom Wilkie, Grafana Labs CTO. “That’s why we built Grafana Assistant: a context-aware AI agent that helps teams move from signal to action faster, right inside the tools they already use. Tools like this – along with other AI-powered capabilities in our open observability cloud, like Asserts knowledge graph and Adaptive Telemetry – are helping companies navigate growing digital complexity and act with greater clarity and speed.”
Also Read: Docyt Launches HpAI, Raising Bar for AI-Powered Accounting
Integrated directly into the Grafana UI, Grafana Assistant serves as a context-aware AI agent that enhances real-time collaboration, incident investigations, and dashboard creation—all through natural language. Instead of writing complex queries or switching between tools, users can simply ask questions to:
-
Understand observability data with in-context guidance and best practices drawn from Grafana’s extensive documentation, blog posts, and community insights.
-
Follow structured inquiry paths during incidents, with AI support trained on real-world SRE workflows—enabling parallel, multi-step investigations.
-
Build and modify dashboards with natural language commands, reducing manual effort and streamlining routine tasks.
-
Navigate seamlessly across Grafana apps and views, as the Assistant interprets URLs and workflows to query logs, metrics, traces, and profiles, as well as declare incidents, define SLOs, or configure alerts.
With these capabilities, Grafana Assistant lowers the barrier to entry for observability, empowering both technical and non-technical users to troubleshoot more efficiently, collaborate with ease, and maintain control of increasingly complex, AI-driven environments.
“Grafana Assistant has transformed how we tackle observability data, acting like a seasoned expert woven into the interface,” said Mikhail Volkov, Founder and CEO of Volkov Labs. “It empowers non-technical users, who might find Grafana’s technical complexities daunting, to swiftly investigate incidents, craft intuitive dashboards, and explore Grafana Cloud with remarkable ease and confidence.”


