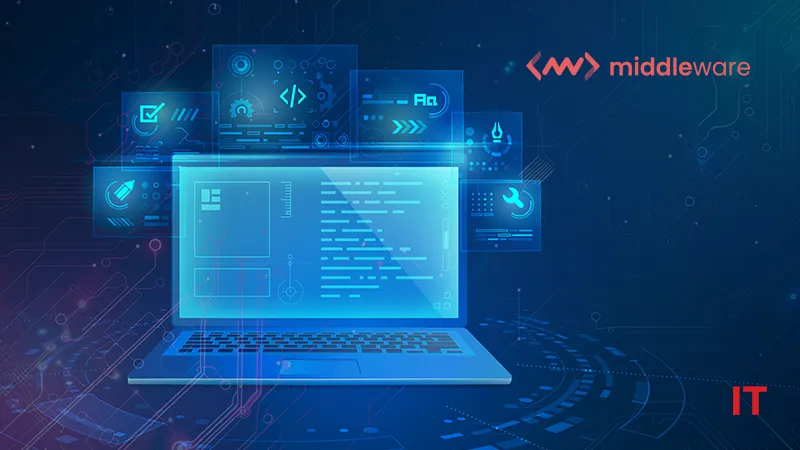
Observability startup, Middleware, announced a new iteration of its full-stack cloud observability platform that helps developers monitor applications and infrastructure in real-time, boost operational efficiency, and minimize downtime. The latest version provides complete control over telemetry data and costs, new monitoring capabilities, faster root cause analysis, and broader integration support.
“Developers no longer want outdated debugging systems. They seek faster, cost-effective, automated solutions, for monitoring distributed architectures with scalable and easy-to-learn real-time observability capabilities. Initially, our goal was to drive adoption by providing cost-effective, end-to-end observability. Now, we’re making it easier for users to instrument services and start quickly, without a steep learning curve. Guided by customer insights, we’re enhancing the UX to transform their journey,” said Laduram Vishnoi, Founder and CEO, Middleware.
What’s improved within Middleware:
- New UI/UX: Middleware now features a completely redesigned frontend, with over 300 refreshed screens, 100 customizable dashboards, new alerts on custom metrics, and a unified date picker.
- Auto Instrumentation: Middleware now supports auto instrumentation for applications written in Python, Node.js, Java, .NET, and Golang using the OpenTelemetry operator. This allows for distributed tracing with zero code changes and simplifies the instrumentation process.
- Datadog Agent Support: Developers can now send logs, metrics, and traces from Datadog agents directly to Middleware. This eliminates the need for new agents or configurations, making the transition to Middleware effortless.
- Status Page: Users can now create status pages and publish them to their websites. It allows for synthetic checks and incident management, providing a public-facing status page that displays the availability of services/products. Users can send notifications via Slack and email, keeping stakeholders informed during outages.
- Product Performance Monitoring within Real User Monitoring (RUM): Middleware’s RUM now tracks core web vitals (FCP, LCP, FID, CLS) and extends to native iOS and Android apps, delivering insights on performance metrics and user interactions across mobile platforms.
- New Integrations: Middleware now supports AWS integration for collecting logs, metrics, and events from ECS, EC2, S3, RDS, Firehose, Lambda, and EBS, simplifying AWS monitoring with less complex configurations. Middleware can also ingest logs from Elastic Logstash, thereby replacing Elastic Search and Open Search.
- Log Patterns: This feature allows users to quickly identify logs with similar patterns, facilitating faster root cause analysis.
“We are committed to making our cloud-native observability platform more powerful, intuitive, and cost-effective by using OpenTelemetry, cloud object storage, and fast analytical query processing. We’re introducing ingestion controls and pipelines for precise user control over telemetry data sent to Middleware. We’ll also leverage AI to detect telemetry anomalies, suggest alerts, and enable querying using natural language,” said Tejas Kokje, Head of Engineering at Middleware.
SOURCE: PRNewswire


